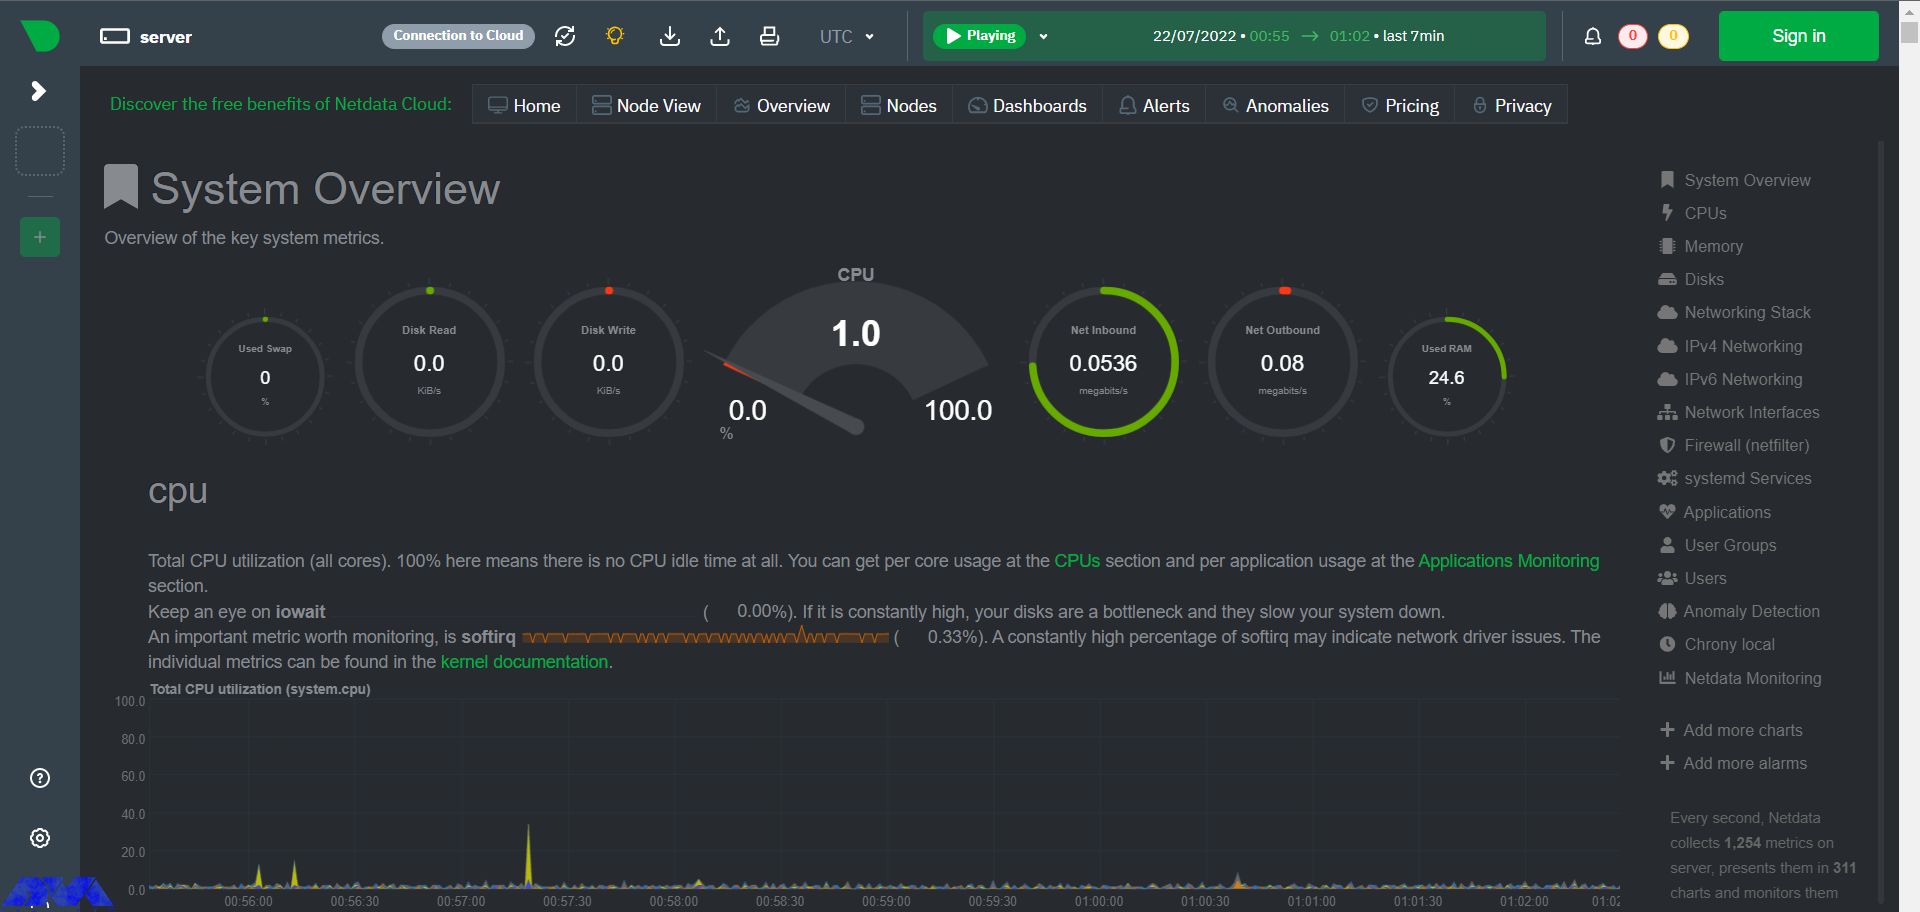


If you are looking for an open-source and real-time server monitoring tool, Netdata is definitely a good choice that offers hundreds of tools to monitor servers, CPU, system processes, memory usage, disk usage, IPv4 and IPv6 networks, a firewall, and more. Netdata works in such a way that it uses collectors to help you collect metrics from your favorite programs and services, and you can view them in interactive and simultaneous graphs. Here we will examine how Netdata is revolutionizing monitoring on Rocky Linux.
Traditional system monitoring involves collecting performance data from servers and network devices and analyzing that data to identify issues. This process can be time-consuming and prone to errors, and it often fails to provide the level of real-time insight that businesses need to stay ahead of potential problems. Netdata, on the other hand, provides real-time monitoring of system metrics, with dashboards and alerts that allow organizations to quickly detect and respond to issues as they arise.
Netdata’s approach to monitoring is significantly different from traditional methods. Rather than collecting data at set intervals, Netdata continuously monitors system metrics, providing real-time insights into system performance. This approach allows businesses to detect and address issues faster than ever before, minimizing downtime and improving overall system performance.
Here we will show you some benefits of using the Netdata monitoring tool on Rocky Linux:
Storing distributed data as close to the edge as possible has made Netdata incredibly scalable. Whether in bare-metal servers or containers, cloud deployments, and IoT devices, Netdata offers lightweight operations, high fidelity, protected privacy, and even good scalability at a fraction of the cost.
Netdata is provided as an open-source program. This means that the entire software and the main building block of the ecosystem (the Netdata agent) is distributed as open-source under the GPL-v3+ license. This tool collects thousands of hardware and software metrics from physical and virtual systems that we call nodes. Also, these criteria are organized in an easy-to-use interface.
Monitoring with Netdata is fun because it doesn’t force you to have a deep understanding of each metric and spend a lot of time configuring monitoring. The tool itself collects, stores, queries, sets alerts, visualizes, and even trains machine learning models for everything. This makes it easier to understand the metrics when you are reviewing your infrastructure and applications or trying to troubleshoot application problems.
The database you install on your system is the Netdata agent. Cloud Netdata is also such that it integrates all agents into a large distributed database. It uses memory, CPU, and disk resources that can be stored and accessed in your production systems in the current state. Each Netdata installation can scale to millions of benchmarks per second, even when you need centralized points to provide higher data access. These things make this tool affordable.
Netdata includes lots of significant features which you can not ignore. These features are:
– Netdata is an easy-to-use and easy and fast setup with full automation.
– It has more than 1000 Plugins and Integrations.
– Real-time and high-fidelity and low latency are other features of Netdata.
– It is equipped with powerful visualizations and dashboards.
– There are powerful notifications and alerts.
– It is flexible and scalable.
– Netdata provides high Security and Privacy.
As mentioned, Netdata is a real-time server monitoring tool that collects real-time data such as CPU, RAM, SWAP usage, bandwidth, etc. We suggest you choose from the Linux VPS servers offered on our website to use the Rocky Linux operating system. Now we will show how to install this applicable tool on Rocky Linux:
The first step is to update your system to the latest version, so use the following command:
dnf update
Then you should run this command to install EPEL repositories:
dnf install epel-release -y
The next step is to install the necessary packages for Netdata. Here is the related command:
wget -O /tmp/netdata-kickstart.sh https://my-netdata.io/kickstart.sh && sh /tmp/netdata-kickstart.sh
Tip: If the script prompts you to enter before installing each package, you must type y or yes and accept the package being installed.
As you finished the installation, start and enable Netdata to boot or reboot automatically and verify the status of the application:
systemctl start netdata
systemctl enable netdata
systemctl status netdata
It is time to configure the firewall on Netdata. The default port for Netdata is 19999. Enable ports in the firewall to use Netdata from your browser:
firewall-cmd --permanent --add-port=19999/tcp
firewall-cmd --reload
Use the URL below on the browser to access the Netdata dashboard:
http://<your IP address>:19999/

Use the configuration file to configure and modify Netdata. This configuration file is located at the at /etc/netdata/netdata.conf directory. You can find this setting by referring to the following URL in your browser:
https://netdata.example.com/netdata.conf
The default configuration will be enough to get started. You can use the desired text editor like Nano to make changes to the configuration options based on your requirements. At last, you have to restart the Netdata service using the following command to apply the changes:
sudo systemctl restart netdata
Netdata agent searches hundreds of standard applications and groups them by purpose. These applications are supported through aggregators. Now for better understanding suppose you want to monitor MySQL database using Netdata. The NetData agent knows that it should look for processes with the string MYSQL along with a few others and put them in the SQL group. After this process, the SQL group is changed to one dimension in all process-specific graphs. Process and group settings are done by two special and powerful collectors.
apps.plugin: This plugin monitors the Linux process tree every moment, like fax top or ps, and collects resource usage information on each running process. Then adds a layer of meaningful visualization automatically on top of these metrics and makes charts for each application.
ebpf.plugin: This plugin collects Berkeley Packet Filter or ebpf in Netdata which monitors Linux kernel-level metrics for file descriptors, process management, or virtual file system IO and then passes processes-specific metrics to apps.plugin in order to monitor. This aggregator aggregates metrics at event frequency. This is more accurate than the standard Netdata detail per second.
Netdata includes a comprehensive set of built-in plugins, but there are also several advanced monitoring plugins to improve its performance, here we will mention some of the best ones:
– Redis: Monitor status by reading the server response to the INFO ALL command from any number of database instances.
– Elasticsearch: With this plugin, you can collect dozens of search engine performance metrics from local nodes and local indexes, including cluster health and statistics.
– Solr: This plugin helps to collect application search requests, search errors, update requests, and error statistics.
– Apache: Apache web server performance metrics can be collected with this plugin through an automated server health endpoint.
– MongoDB: This can be used to collect server, database, replication and sharing performance, and health metrics.
– Nginx: Monitor web server status information by collecting metrics via the ngx_http_stub_status_module.
– MySQL: This widely used plugin collects global database, replication, and statistics for each user.
Netdata is not the only monitoring tool available, but it is one of the most powerful and feature-rich. Here are some of the key differences between Netdata and other monitoring tools:
– Real-time monitoring: Netdata provides real-time monitoring of system metrics, allowing businesses to quickly detect and address issues as they arise.
– Highly customizable dashboard: Netdata’s dashboard is highly customizable, allowing businesses to track the metrics that matter most to them. This can help businesses stay on top of potential problems and improve overall system performance.
– Advanced analytics and troubleshooting tools: Netdata provides a range of advanced analytics and troubleshooting tools, including the ability to analyze historical data and identify trends over time.
– Plugin architecture: Netdata’s plugin architecture allows businesses to extend its monitoring capabilities beyond the built-in metrics, providing a more comprehensive view of their systems and applications.
If you are interested in Monitoring tools, you should know that Netdata is one of the best. So we focused on this amazing tool to give a clear understanding of Netdata and give a full explanation about its benefits, features and also show how you can install and configure it on Rocky Linux. You can also figure out some differences between Netdata and other monitoring tools. We hope this tutorial was helpful enough for you.
Use the following commands:
wget -O /tmp/netdata-kickstart.sh https://my-netdata.io/kickstart.sh && sh /tmp/netdata-kickstart.sh –uninstall.
curl https://my-netdata.io/kickstart.sh > /tmp/netdata-kickstart.sh && sh /tmp/netdata-kickstart.sh –uninstall.
Yes, you can use plugins because Netdata architecture supports plugins and allows you to extend functionality.
How useful was this post?
Click on a star to rate it!
Average rating 0 / 5. Vote count: 0
No votes so far! Be the first to rate this post.
 Tags
Tags

In this tutorial, you will learn how to add a new DNS zone with WHM on the dedicated server. To expl...


 Tags
Tags

RDP is an acronym for Remote Desktop Protocol, which is specific to Windows servers. You can use RDP...


 Tags
Tags
What is your opinion about this Blog?


